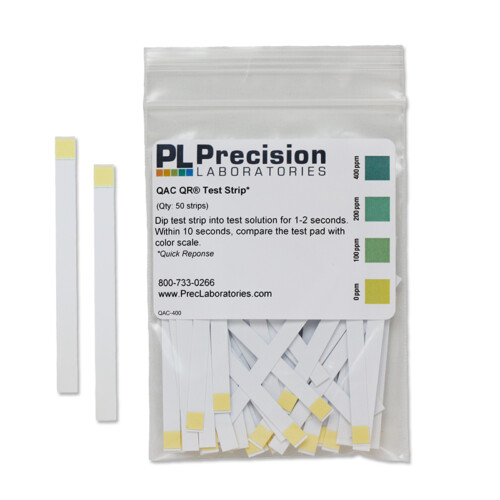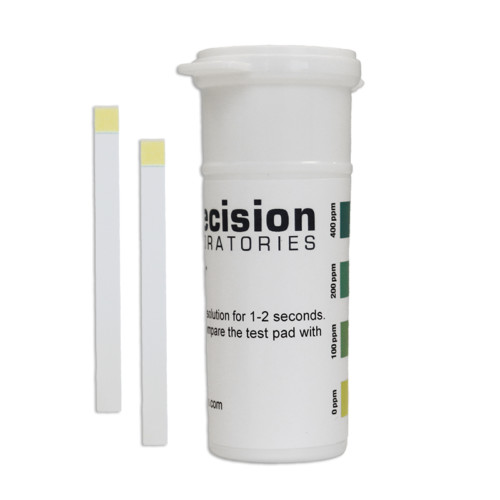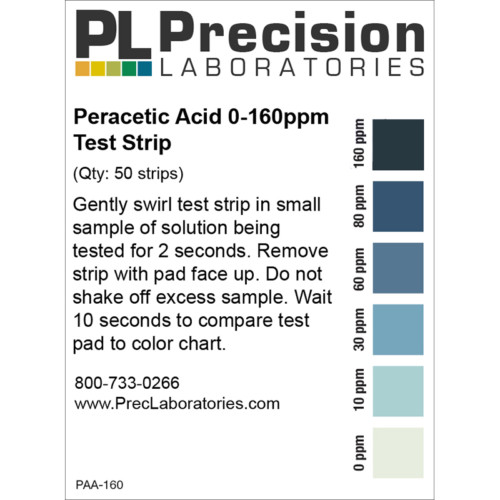
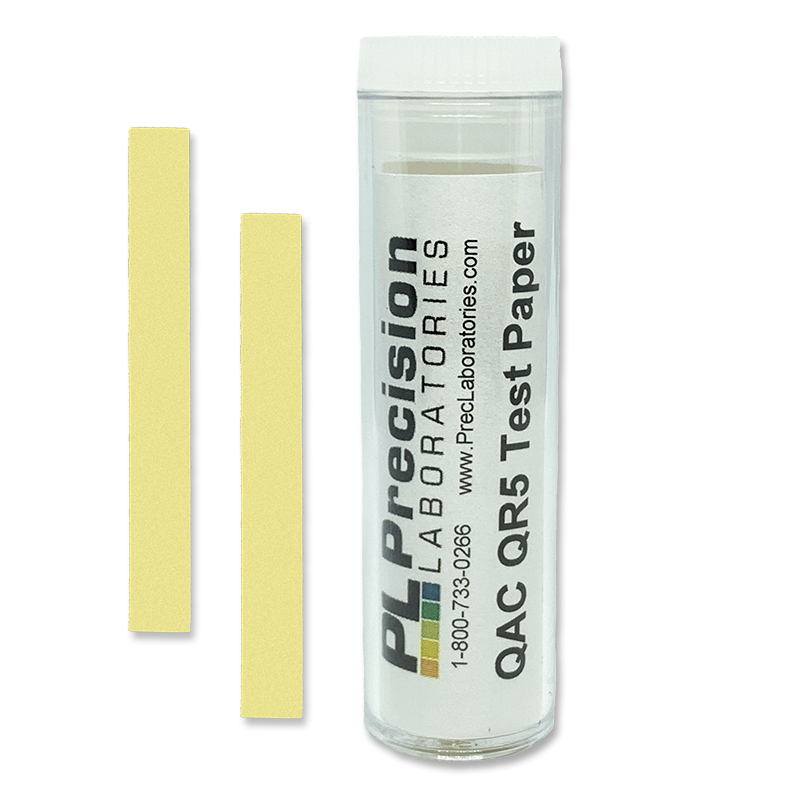
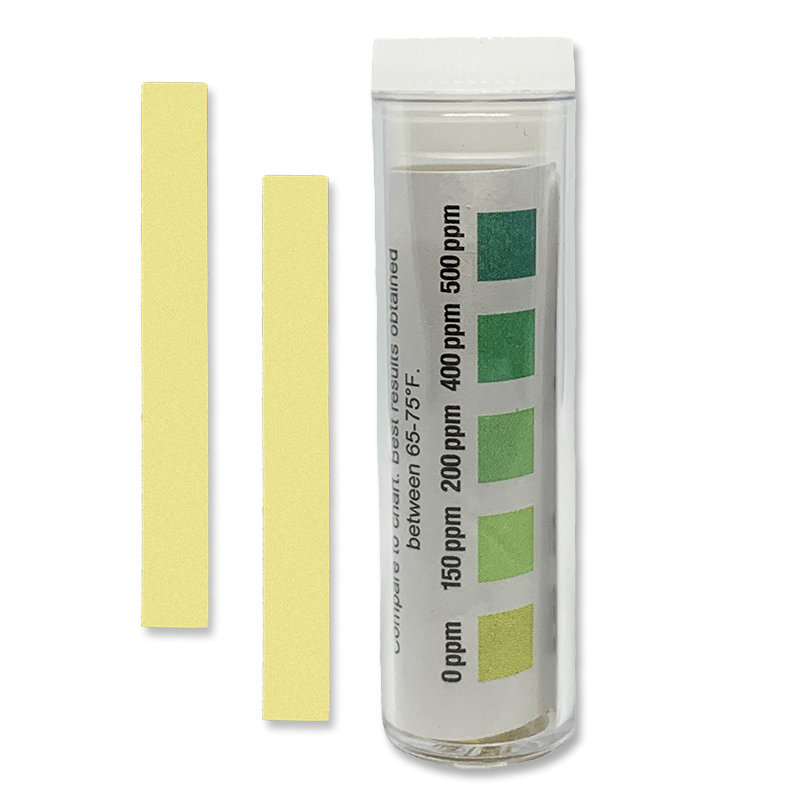
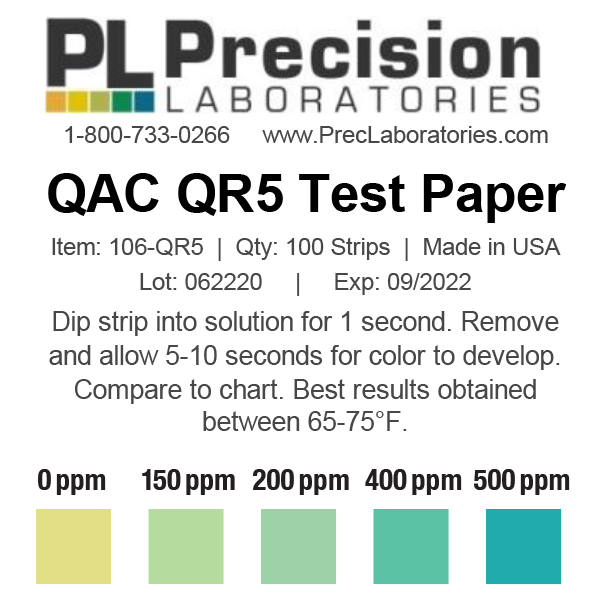
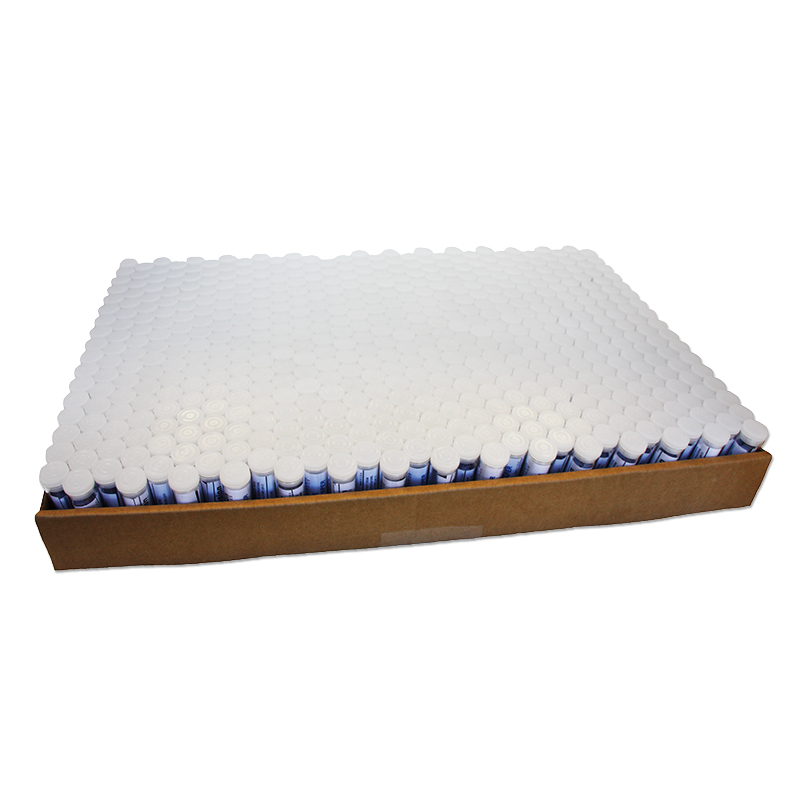
QAC QR5 Test Paper is used to detect the strength of quaternary ammonium compounds in sanitizers in just seconds. QAC Compounds exhibit microbicidal activity to most microbes at 200ppm concentration.
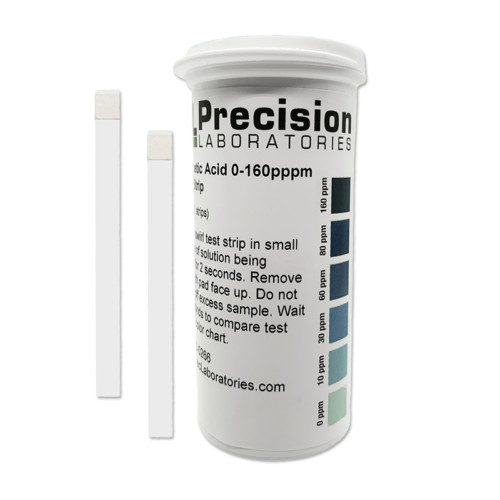
QAC QR5 Test Paper
QAC QR5 Test Paper
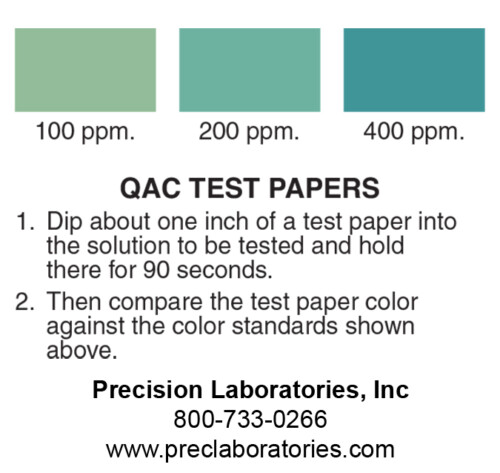
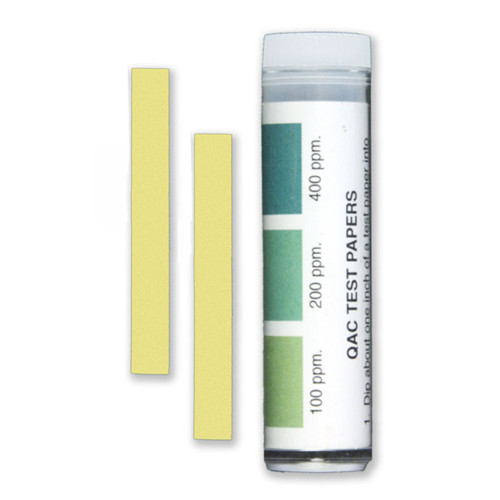
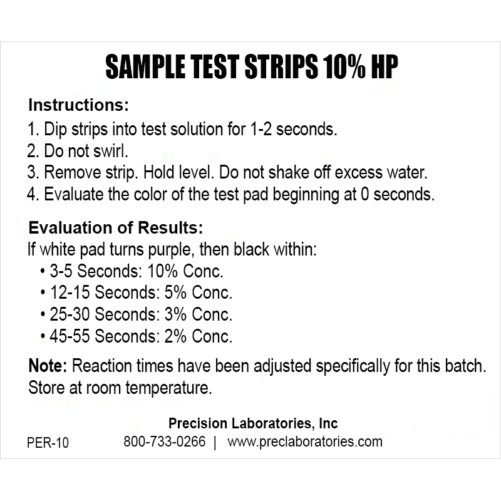
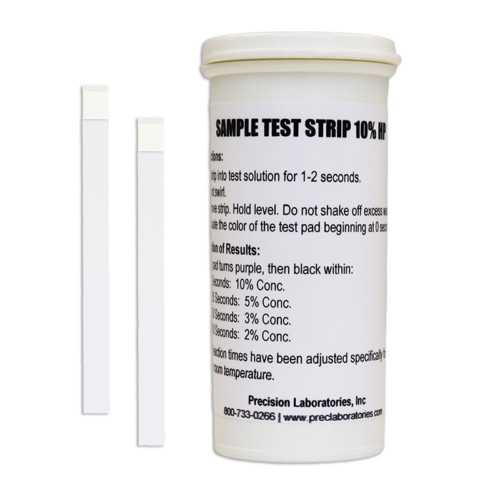
- Remove a QAC QR5 test paper from the vial, being careful not to touch the strip anywhere other than where you grasp it with your fingertips.
- Dip about 1″ of test paper into the solution to be tested for 1 second.
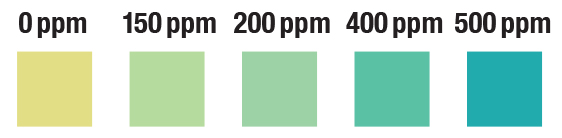
- Allow 5-10 seconds to develop, then compare to the color chart.
NOTE: The test strips should be kept in closed vials when not used, out of direct sunlight, at room temperature.
Precision Laboratories quat test papers and strips utilize an effect commonly referred to as the “protein-error of indicators” to quantify the QAC ppm levels. While first observed with proteins (thus the name), the technique utilizes pH indicators and buffering systems to create an environment where the test paper or strip reacts (develops color) proportional to the amount of analyte (QAC) present. The PL quat test papers and strips have color charts calibrated to solutions prepared from OASIS 146, an industry standard quat product. The performance of the papers and strips with alternate quat products should always be verified. In addition, any additives should be evaluated to see if they contribute to the “protein-error” effect.
QACQR5; 106-QR5; 106-QR5-12V-100; 106-QR5-144V-100; 106-QR5-500V-100
Product Specs
| SKU 1: | 106-QR5-12V-100 (12 vials, 100 strips/vial) |
|---|---|
| SKU 2: | 106-QR5-25V-100 (25 vials, 100 strips/vial) |
| SKU 3: | 106-QR5-144V-100 (144 vials, 100 strips/vial) |
| SKU 4: | 106-QR5-500V-100 (500 vials, 100 strips/vial) |
| Strip Quantity: | 100 strips |
| Vial Dimensions: | .75″ (D) x 2.75″ (H) [19mm (D) x 70mm (H)] |
| Strip Dimensions: | 1.875" (L) x .25" (W) [48mm (L) x 6mm (W)] |
| Box Dimensions: | 10" x 10" x 2.75" [29.8 cm x 19 cm x 7 cm] (144-pack box), 21" x 14.75" x 3" [53.3 cm x 37.5 cm x 7.6 cm] (500-pack box), 3.25" x 2.375" x 3" [8.3 cm x 6 cm x 7.6cm] (12-pack box), 5" x 3.5" x 3" [12.7 cm x 8.9 cm x 7.6 cm] (25-pack box) |
| Weight: | 0.02 lbs [9 g] (single vial) |
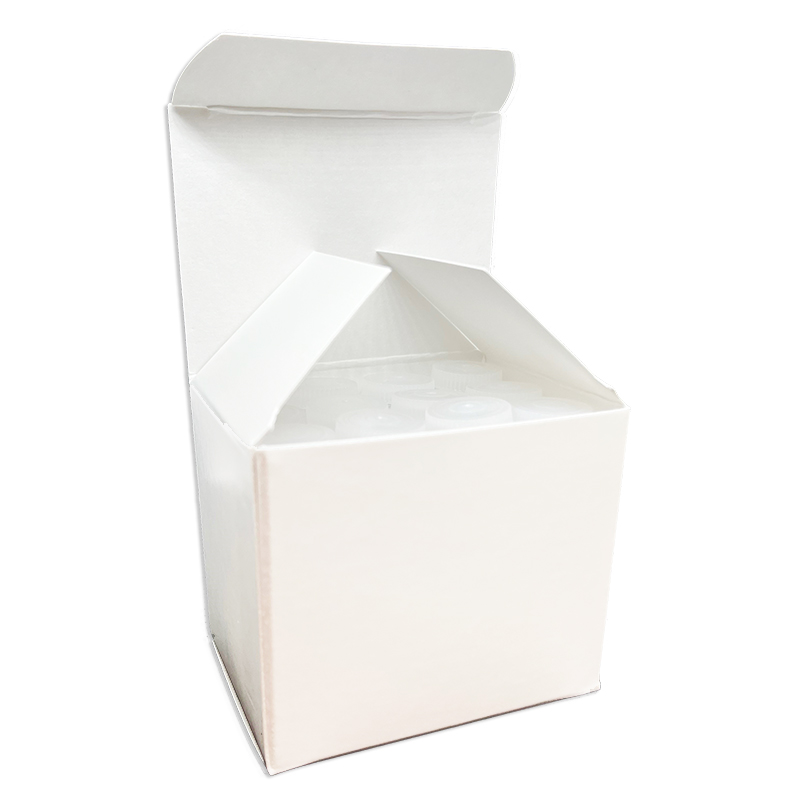
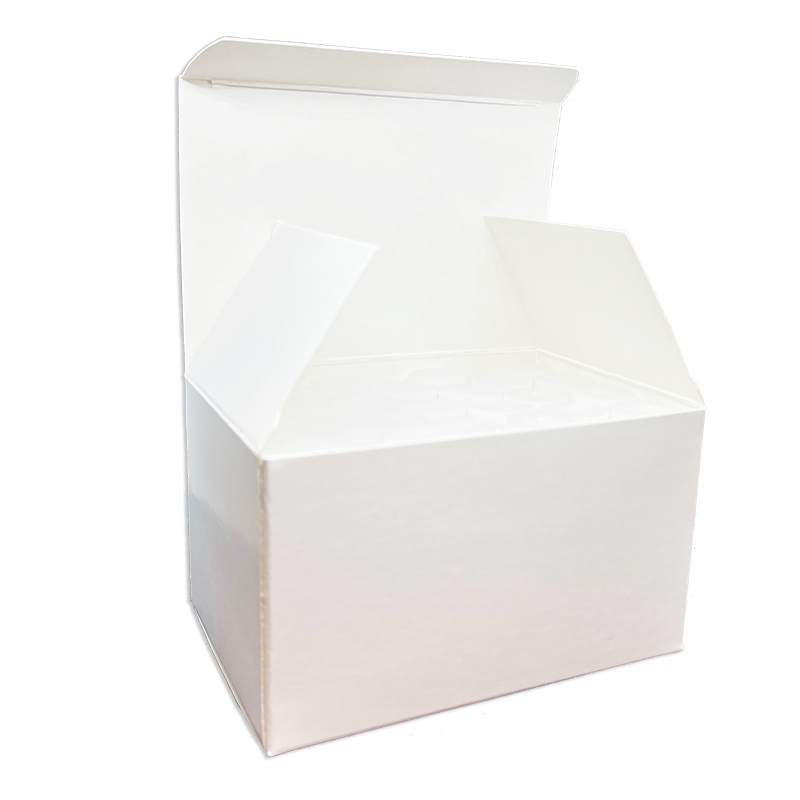
| Other: | Stored in a pocket-sized, lightweight vial. |
| Shelf-Life: | 2 Years |
| Label: | Customizable Label |
Product Documentation
How are the ppm levels quantified on the QAC test strips?
Precision Laboratories QAC test papers and strips utilize an effect commonly referred to as the “protein-error of indicators” to quantify the QAC ppm levels. While first observed with proteins (thus the name), the technique utilizes pH indicators and buffering systems to create an environment where the test paper or strip reacts (develops color) proportional to the amount of analyte (QAC) present. The PL QAC test papers and strips have color charts calibrated to solutions prepared from OASIS 146, an industry standard QAC product. The performance of the papers and strips with alternate QAC products should always be verified. In addition, any additives should be evaluated to see if they contribute to the “protein-error” effect.
What is the difference between your Quat strips and other manufacturers?
A health inspector using QT-40 test strips compared their results to a customer using our QAC QR5 test strips, and the results were the same. The strips, however, are different in color and appearance. So, what is the difference?
Our QAC QR5 uses a different formula from the other strips, but should react about the same. We calibrate our colors using an industry leader Quat formula and in most cases, but not all, the strips will work with chemicals that are similar.
What are the dilution instructions for Quat (QAC) solutions?
to test your strips.
Oasis 146
To prepare a 400ppm QAC solution, dilute 0.530ml of Oasis 146 into 100ml of water.
| Active Ingredients | Conc. | Active Ingredients | Conc. |
| Alkyl dimethylbenzyl ammonium chloride | 3.00% | Octyldecyl dimethyl ammonium chloride | 2.25% |
| di-n-octyl dimethyl ammonium chloride | 0.90% | di-n-decyl dimethyl ammonium chloride | 1.35% |
Hyamine 3500-80%
Prepare a stock solution by dissolving 1.25g in 100ml of water to produce a 10,000ppm solution. To prepare a 400ppm QAC solution, dilute 4ml of the stock solution into 100ml of water.
| Active Ingredients |
| n-Alkyl (C14=50%, C12=40%, C16=10%) dimethylbenzyl ammonium chloride-80% |
Bardac 2280
Prepare a stock solution by dissolving 1.25g Bardac 2280 in 100ml of water to produce a 10,000ppm solution. To prepare a 400ppm QAC solution, dilute 4ml of the stock solution into 100ml of water.
| Active Ingredients |
| Didecyldimethyl ammonium chloride-80% |
Bardac 2250
Prepare a stock solution by dissolving 2g Bardac 2250 in 100ml of water to produce a 10,000ppm solution. To prepare a 400ppm QAC solution, dilute 4ml of the stock solution into 100ml of water.
| Active Ingredients |
| Didecyldimethyl ammonium chloride-50% |
Sysco QAC Tablets
To prepare a 400ppm QAC solution, place 1 tablet into 2.82L (1 US Gal.) of water.
| Active Ingredients |
| Alkyl (C14=95%, C12=3%, C16=2%) dimethylbenzyl ammonium chloride-50% |
Does the accuracy of QAC test strips depend on the pH of the solution?
The accuracy of QAC tests strips does not depend on the pH value of solutions to be tested in the range of 1.86 – 9.2 pH, but rather it depends on buffering capacity. When the pH of a solution to be tested is a result of acidic or alkaline compounds without buffering capacity, then the accuracy of the test is not influenced. In the case that the pH of a solution to be tested is a result of a buffer, then the measure of influence depends on the buffering capacity of the solution.
Test:
Sets of control solutions with QAC concentrations 0 – 50 – 100 – 200 – 400 ppm were prepared in following solutions:
- Hydrochloric acid /0.1 M/, pH 1.1
- Tartaric acid /0.1M/ , pH 1.86
- McIlvaine buffers (0.1M citric acid, 0.2 M disodium hydrogen phosphate), pH 2.2 – 3.0 – 4.0 – 5.0 – 6.0 – 7.0 – 8.0 – 9.0
- Sodium tetraborate /0.01M/ , 9.20
The table below contains readings according to the regular color chart:
| pH buffer /b/ | 0 ppm QAC | 50 ppm QAC | 100 ppm QAC | 200 ppm QAC | 400ppm QAC |
| 1.1 | 0 | 0 | 0 | ≤50 | 50 |
| 1.86 | 0 | 50 | 100 | 200 | 400 |
| 2.2 /b/ | 0 | 0-50 | 50 | 100 | 200 |
| 3.0 /b/ | 0 | 50 | 100 | 200 | 400 |
| 4.0 /b/ | 0 | 50 | 100 | 200 | 400 |
| 5.0 /b/ | ≤ 50 | 100 | 200 | 400 | ≥400 |
| 6.0 /b/ | 50 | 200 | 400 | higher | higher |
| 7.0 /b/ | 100 | 400 | ≥400 | higher | higher |
| 8.0 /b/ | 200 | 400 | higher | higher | higher |
| 9.0 /b/ | 400 | higher | higher | higher | higher |
| 9.2 | 0 | 50 | 100 | 200 | 400 |
Does temperature affect QAC test strip results?
Higher temps:
Testing was run on set of control solutions 0 – 50 – 100 – 200 – 400 ppm Hyamine 1622 (Fluka) warmed up to temperatures in the range 35 – 60oC.
| T (oC) | QAC strips reading in control solutions 0 – 50 – 100 – 200 – 400 ppm |
|---|---|
| 35 | reading OK in the whole concentration range |
| 40 | reading OK in the whole concentration range |
| 45 | 0 – 50 - 100 ppm OK, 200 and 400 ppm reading cca half color square higher |
| 50 | 50 – 100 ppm reading cca half color square higher, 200 – 400 ppm reading 1 color square higher |
| 55 | reading 1 color square higher in the whole range |
| 60 | reading 1 color square higher in the whole range |
Lower temps:
Testing was run on a set of control solutions at 100, 200, 300, and 400 ppm QAC using Oasis 146 stock.
The samples were split, so that one set was kept at room temp (76F) and one set was placed into the refrigerator (38F). Both the paper strips (SKU: 106) and the plastic backed test pads (SKU: QAC-400) were tested. The test papers showed no visual difference at any of the concentrations. The plastic backed strips did not show any visual difference, with the exception of the 100 ppm standard. The refrigerated standard read slightly lower (maybe ¼-½ a color unit, read as 50-75 ppm). The test was repeated several times and these results were confirmed.