

In this glucose experiment, students can explore the basis of lactose intolerance using our Glucose test strips. This experiment is brought to you by Karen Kalumuck from Exploratorium. Check out the Exploratorium website for tons of fun activities, called Science Snacks. Exploratrium Science Snacks are miniature versions of some of the most popular exhibits at the Exploratorium.
Background
Lactose is milk sugar. It’s composed of two molecules of “simple” sugars chemically bonded together: glucose and galactose. The enzyme lactase breaks down lactose into glucose and galactose, which we can easily digest.
Most babies produce abundant quantities of lactase for milk digestion. However, in the vast majority of adults, the gene which specifies production of lactase is turned “off,” so they can’t digest lactose. They’re lactose intolerant.
Symptoms of lactose intolerance include cramps and diarrhea. The lactose molecule, which is large, accumulates in the large intestine and affects the osmotic balance there. Since water moves across semipermeable membranes, such as the intestine, from areas of high concentration to low concentration, the addition of large lactose molecules causes water to enter the intestine. This can result in the very unpleasant experience of watery stool or diarrhea.
Since lactose is a sugar, it’s an ideal food for the bacteria which normally inhabit our intestine (and are essential to digestion). However, the lactose will be fermented by these same friendly bacteria, and organic acids are gas produced by them. We all know what discomfort intestinal gas can cause! So most folks who are lactose intolerant choose to avoid lactose-containing milk products, or modify the lactose, to avoid the cramps and diarrhea associated with the intolerance syndrome.
Materials

- Regular milk
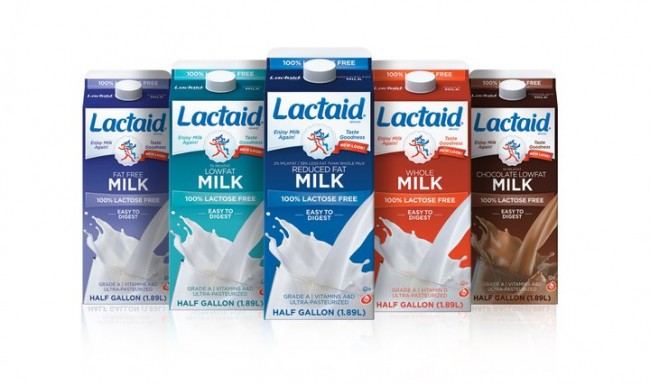
- Lactaid milk (Lactaid 100 is 100% lactose free; available at most grocery stores; some stores now carry their own brands – just be sure it is 100% lactose free)
- Lactase drops (ex. Dairy Ease brand) referred to as “mystery drops” (available in most grocery or drugstores; cover the labels with paper or colored tape to hide the identity of this “mystery drops” from students.
- Test tubes, to contain about 20ml fluid (minimum 3 per pair or group of students; additional available for student’s own ideas)
- Glucose test strips (minimum 6 per group, but more available to encourage students to test other hypotheses)
- 2% glucose solution: make by dissolving 2g or glucose (or dextrose) in 100 ml water or by grinding one glucose tablets (4 grams/tablet; found in drugstores) in 200ml of water
NOTE: The Glucose Test Strip color chart reads concentrations as mg/dL. To convert this to a percentage, 1% is 1 g (1000 mg) per deciliter. Thus, the color chart increments in percentages are as follows: 0-0.1%-0.3%-1%-3%.
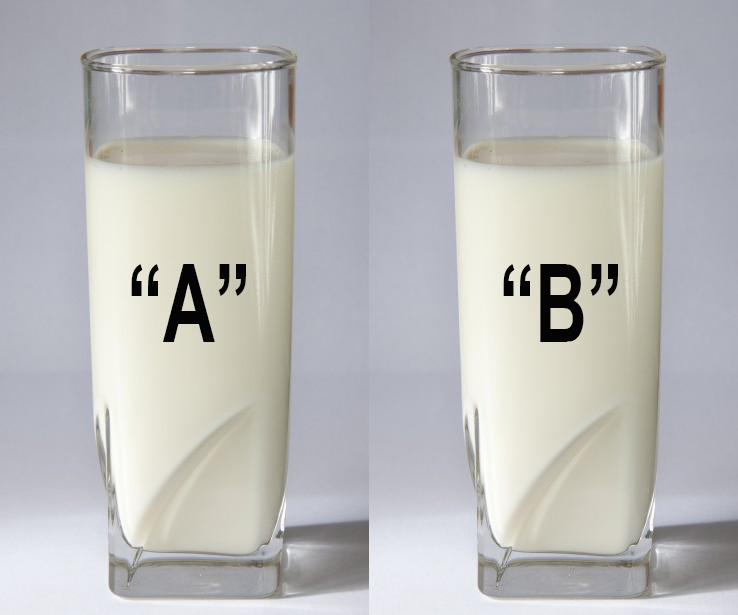
- Pour about ½” of regular milk (about 3 ml) and Lactaid (lactose free) milk into separate test tubes, one of each for each group, and label “A” and “B” to hide the identity of the fluids from the students.
- Determine the glucose concentration of “A” by dipping a glucose test paper into the solution for 1-2 seconds. After 60 seconds, compare the color of the strip with the color chart to determine the concentration of glucose in the milk.
- Determine the concentration of glucose in “B” by dipping a glucose test paper into the solution for 1-2 seconds. After 60 seconds, compare the color of the strip with the color chart to determine the concentration of glucose in the milk.
- Class results should be tabulated on the board so that everyone can see them. Acknowledge that small variations between groups may be due to differences in how the procedure was carried out (for example, if students did not wait 60 seconds to read the strip, small variations in results may be obtained). Do not be overly concerned about small variations, as long as the water is “negative” for glucose and the glucose solution is “positive” for glucose.
- Add one drop of “mystery drops” to one half inch of “A” (the same “A” from step #3). Warm the milk by rolling the tube back and forth in your hands for 2 minutes. Repeat the glucose test with a fresh test strip as indicated in #3 above. Is the glucose concentration now the same or different as compared to the concentration in “A” prior to adding the “mystery drops”?
- Add one drop of mystery fluid to “B” (the same “B” from step #4 above. Warm the milk by rolling the tube back and forth in your hands for 2 minutes. Repeat the glucose test with a fresh test strip as indicated in #4 above. Is the glucose concentration now the same or different as compared to the concentration in “B: prior to adding the “mystery drops”?
- Tabulate class results on the board, as in #5 above.
- Explain your results. Is there a difference in glucose concentration between fluids “A” and “B” before addition of the “mystery drops”? Hypothesize as to what the difference means. Do the glucose concentrations of “A” and “B” change after the addition of the “mystery drops”? What could account for the change?
At this point, students may conclude that somehow the “mystery drops” converted something in the regular milk to glucose. This may be true, but at this point one other possibility can’t be ruled out – see if the class can think of what that is.
If they are unable to present an alternate hypothesis, prod them with the following:
How do you know that the mystery drops are not glucose? The “mystery drops” are added to a substance which had a negative glucose reaction, and all of a sudden that same substance gives a positive reaction. Unless the mystery drops (i.e. lactase drops) themselves are tested with the glucose strips, no conclusions can be reached! Students should then test the “mystery drops” with the glucose strips. Add the result of this test to the data recorded on the board. Now what sort of conclusions can be drawn from the data?
The lactase enzyme breaks down milk sugar, which is lactose, into glucose and galactose, making it digestible for people with lactose intolerance.
Regular milk contains a high concentration of lactose but no glucose, as shown by the negative reaction of the glucose test strips (no color change). The lactose-free milk has been treated with lactase, which broke down the lactose into glucose and galactose; when lactose-free milk is tested, the glucose test strips will change color to indicate a high concentration of glucose present in the milk. When lactase drops are added to the regular milk, the enzyme breaks down the lactose into glucose and galactose, as revealed by testing lactase treated milk with the glucose test strips. It’s very important that someone in the class test the lactase drops – after all, they’re the “mystery drops” and how do you know it isn’t just a bottle of glucose? Let the students figure out that the “mystery drops” should be tested, and they will give a negative reaction to the glucose test.
The vast majority of the worlds’ peoples are lactose mal-absorbers (lactose intolerant). All Eskimos and American Indians studied thus far, as well as most sub-Saharan African peoples, Mediterranean and Near Eastern groups as well as those of Indian, Southeastern and East Asian descent, and Pacific groups contain a vast majority of lactose mal-absorber.
There is a strong correlation of the incidence of adult lactose absorbers (lactose tolerant) and those whose ancestry included dairying as a means of subsistence. For example, among hunter-gatherer societies which traditionally lack dairy animals, about 2.5% of the Kung Bushmen are lactose absorbers, ranging to a maximum of 22.7% of the Twa Pygmies of Rwanda. The average percentage of adult lactose absorbers for non-dairying agriculturalists (such as the Yoruba and Hausa of Africa) is 15.5%, as contrasted to milk-dependent pastoralists (such as the Arabs of Saudi Arabia and Tussi in Africa) where the average percentage of lactose absorbers is 91.3%.
Dairying peoples of northern European descent average 91.5% adult lactose absorbers. Some groups of peoples do have intermediate percentages of lactose absorbers in their populations, but these groups are the vast minority and stem from societies which have ancestry in both absorber/non-absorber populations. These mixed populations are largely the dairying peoples of North Africa and the Mediterranean, including Jews in Israel, Ashkenazic and other Jews, Arabs, Egyptians and Greeks. These groups average 38.8% adult lactose absorbers, with a range of 0% (non-Saudi Arabs) to 52.1% (mainland Greeks) among individual ethnic groups.
In general, only Northern Europeans, who drink a lot of milk seem to have a high degree of lactose tolerance in the adult population. Many Americans are lactose tolerant, due to mixing of ethnicities – lactose tolerance seems to be genetically transmitted. The speculation is that at some point, a mutation occurred which caused individuals to produce lactase throughout their lives, and for some reason this trait gave these individuals a survival advantage and was selected for during natural selection.
In very early human societies, people did not consume milk beyond early childhood, so the lactase gene was “turned off”. As people migrated to distant parts of the world and domesticated cattle, in some instances, dairy products provided a food source through adverse winter conditions. Hence, Northern Europeans whose lactase gene remained active could consume milk products without becoming ill, thus providing a survival advantage. This was not an issue in warmer climates where food was cultivated year-round and societies were not tied to dairy cattle for sustenance. Thus, the majority of the world’s populations, whose ancestors were not dependent upon dairy products for survival, retained the characteristic of adult lactose malabsorption with no adverse consequences to them.
Speculation as to why the lactose gene “turns of” is a fascinating topic. One theory suggests that lactase deficiency evolved early in mammalian history, perhaps 75 million years ago, as a means to facilitate weaning and shorten the dependence of the child on the parent for lactation. The gas and diarrhea produced by lactose malabsorption would stimulate the child to become weaned. One competing theory suggests that lactose malabsorption in adults prevents competition of adults with infants for food (who can only digest milk early in life), and another theory proposes that lactose intolerance evolved as a defense mechanism against intestinal infections.
This activity can also be used as an exploration of enzyme function. Concentration of lactase enzyme, effects of temperature, acids, bases on its activity can all be tested. Since nearly all enzymes are proteins, these macromolecules are subject to the physical properties which affect protein structure.
The proper functioning of enzymes are directly related to their three-dimensional structure. Physical factors such as heat, extremes of pH and salinity can cause the denaturation, or unfolding of the enzyme’s three-dimensional structure, thus preventing it from normal functioning.
Gentle heating and cooling, as well as the concentration of the enzyme in a chemical reaction, may affect how long the reaction takes to complete. These enzyme properties can all be easily tested in the context of this lactase experiment. For example, heat a bottle of lactase to boiling prior to use. Let cool. Repeat the experiment as outlined above. Are there any differences in results? The lactase should be denatured, and will not be able to convert lactose into glucose and galactose.
This experiment was brought to you by Karen Kalumuck from Exploratorium. Check out the Exploratorium website for more activities.
References:
Durham, William H. Coevolution; Genes, Culture and Human Diversity. Stanford University Press, Stanford, CA. 1991. Of particular interest is chapter 5, “Cultural Mediation: The Evolution of Adult Lactose Absorption” which gives an in-depth discussion of the biology of lactose malabsorption, distribution of absorbers and malabsorbers and theories to explain the phenomenon.
Campbell, Neil. Biology. 4th ed. 1996. Benjamin/Cummings, Redwood City, CA. This textbook contains an excellent discussion of enzymes and their properties in Chapter 6, “An Introduction to Metabolism”. The level of content is suitable for the nonspecialist and specialist alike.
Kalumuck, Karen E. “Enzyme Explorations”. CSTA Journal, Spring, 1996. This article includes the lactase experiment described in this activity, and one other enzyme activity which could be used to model experiments about physical factors which affect lactase activity.


Leave A Comment