

Here in the desert, water is an extremely important resource that is sometimes hard to find. In Cottonwood, Arizona, where we manufacture our products, we have the Verde River, which flows through our little town year-round. The river supports all kinds of wildlife, and several local nonprofits work hard to keep it safe. Local and state programs are also teaching our young students about the importance of this resource and the various effects that humans can have on it.
Today, we’re going to do an experiment that tests the effects of fertilizer on an aquatic environment. Students have learned from the local watershed project that chemicals from farms, gardens, industrial plants, etc. can reach our rivers, ponds and streams, and affect the wildlife.
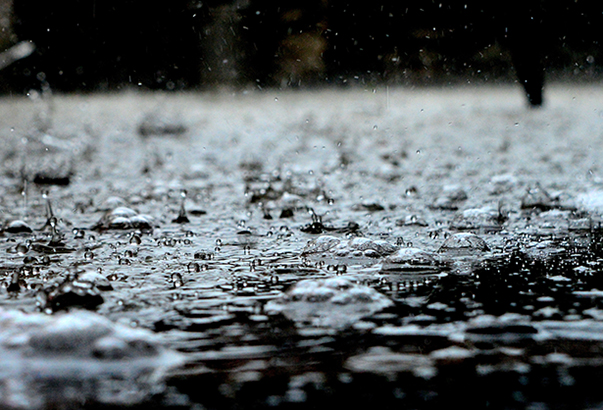
When farmers use fertilizer, heavy rains or excess watering can flow along the surface of the field, carrying the fertilizer into a natural body of water. This is called runoff. Fertilizer can also penetrate the ground water system, contaminating and polluting it. The polluted ground water can also leak into nearby bodies of water.
Fertilizers contain many different chemicals, some of which are harmful to our environment and have led to more and more organic farming methods. How do these chemicals affect the aquatic ecosystem? Let’s find out.
Materials
- 100ml beaker
- pH 1-14 test strips
- 2 types of small aquatic animals, such as snails, water fleas, leaches, etc.
- You can find these in your local water environment or from a pet store
- 2 types of small aquatic plants, such as duckweeds, waterweeds, java moss, java fern, etc.
- You can find these in your local water environment or from a pet store
- 4 Lidded plastic containers
- Distilled water
- 3 brands of liquid fertilizer
Instructions
- Make sure each plastic container is thoroughly rinsed, as soap residue will be harmful to your aquatic life.
- Assign a number to each fertilizer and mark the label of each bottle with the number. Then, label the containers “1”, “2”, “3” and “control”.
- Using the beaker, measure 975 mL of distilled water, and pour it into container #1. Then measure 25 mL of fertilizer #1 and pour it into the same container. Repeat this step for each fertilizer in its respective container.
- In the control container, pour 1000 mL of distilled water only.
- Check the pH strips of each container. You will need 1 strip per solution. Dip the strip into the solution and remove immediately. Compare it to the color chart and record your results.
- Distribute the aquatic plants and animals evenly among all of your containers, putting at least 5 animals and 3-10 plants into each container. If you put more than one type of animal in a container, make sure you put the same amount of each in. For example, if you are using snails and leaches, place 3 snails and 3 leaches in container #1. The amount of plants/animals you put in each container will depend on the size of the container.
- What do you think will happen to the plants and animals? Which fertilizer do you think will be most toxic and which least toxic?
- Now, it’s time to observe. Check on the containers every day for 5 days. Count the number of animals that are alive and the number of plant leaves in each container. Test the pH of each container’s solution daily.
Results
Analyze the results and compare them to your hypothesis. Did one type of fertilizer affect the aquatic life more than another? What types of results or reactions did you see from the animals and plants? Which fertilizer seemed to be the least toxic? Which was the most toxic? Is this what you hypothesized? Did you try an organic fertilizer? Did it have less of an effect on the aquatic life? How did the fertilizer affect the pH of the water, and how do you think the pH affected the aquatic life?


Leave A Comment